
For many, the world came to a halt in mid-March with the impact of the Covid-19 pandemic. Due to stay-at-home orders, daily routines changed rapidly and drastically. Not surprisingly, these changes in work life and leisure activities caused changes in TV viewership.
Television viewing already was up in the beginning of 2020, and the pandemic just compounded those increases. With more people home during the day, viewing not only increased, but, with the cancellation of sporting events, viewing patterns shifted – with the largest increases seen in daytime viewing and on the news networks.
Among the findings for Q1 2020:
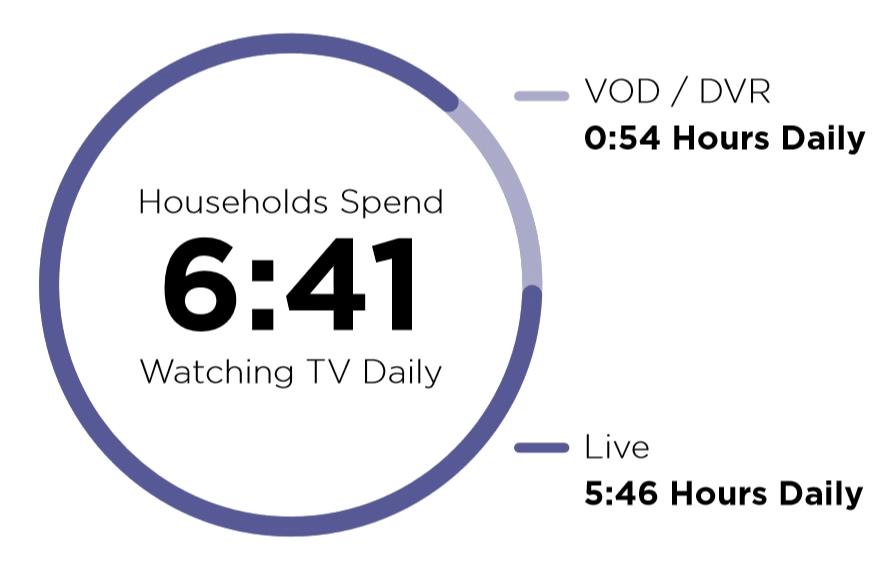
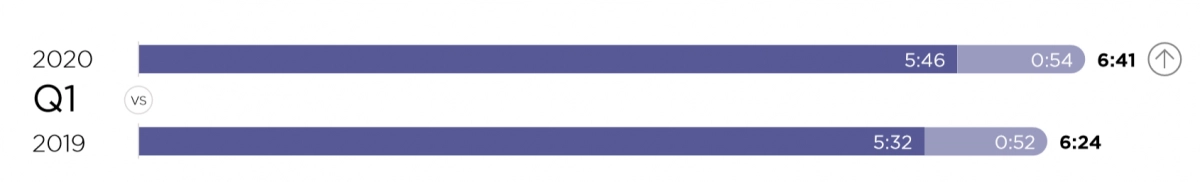
The average Xfinity household spent 6 hours, 41 minutes with television daily – the highest daily time spent with television since tracking began in 2017.
Live viewing accounted for 87% of all viewing, while time-shifted (VOD/DVR) accounted for 13%.
Xfinity households spent 17 more minutes with television daily compared to last year. Live viewing drove 88% of the year-over-year growth for the quarter, with VOD/DVR viewing representing 12%. In late March, this shifted due to heightened increases with VOD usage. Post shut-down, in the last two weeks of March, live and VOD/DVR viewing represented 80% and 20% of the year-over-year growth respectively.
In those last two weeks of March, other viewing patterns shifted as well. While total viewing increased throughout the day, the biggest percentage gains were seen in daytime viewing (+37%) and overnight viewing (+24%). There were shifts in the type of programming watched as well – the biggest increase in viewing was on news networks, which were up 39% in March.
Now, more than ever, it’s important for marketers use data-informed approaches to find audiences wherever and whenever they are viewing content. Even without sports and other tentpole programming, viewing is up year-over-year – it has just shifted to more networks and different dayparts.
The TV Viewership Report Q1 2020
About The TV Viewership Report:
Effectv’s TV Viewership Report looks at the current position of TV viewing across the Comcast footprint. Released for the first time in July, 2019, the report will now be released on a bi-annual basis, with a summary of 1H 2020 coming in August, 2020.
The report is intended to inform and educate marketers who want to make the most of their ad buying strategies by better understanding the nuances of television viewing. The viewership insights included in the reports come from over 17 million Xfinity households (HHs) across 60+ markets. For the latest, visit effectv.com/insights.