The race for viewers is on, and sports is leading the charge. In today’s ever-evolving video landscape, grabbing attention is tougher than ever. But for advertisers, sports delivers a game-changing advantage: large, engaged audiences watching in real time.
2024 was a major year for sports. From NBC’s streaming coverage of the Paris Olympics to the WNBA’s record-breaking season, sports content dominated screens and platforms to deliver millions of viewers around the globe. And with 85% of fans preferring to watch live games on TV over attending in person,1 the momentum is only growing.
Here’s how sports dominated screens last year, and why that matters for advertisers looking to maximize reach in 2025.
Sports programming commands attention like no other genre – delivering massive, loyal fans and casual sports viewers alike. It topped viewership in 2024, accounting for 96% of the most-watched non-political programming.2 Sports programming gives advertisers full court access to highly engaged viewers, advertisers just have to take a seat.
In 2024:
of sports programming was viewed live4
of households reached by sports were incremental, or unique to sports content5


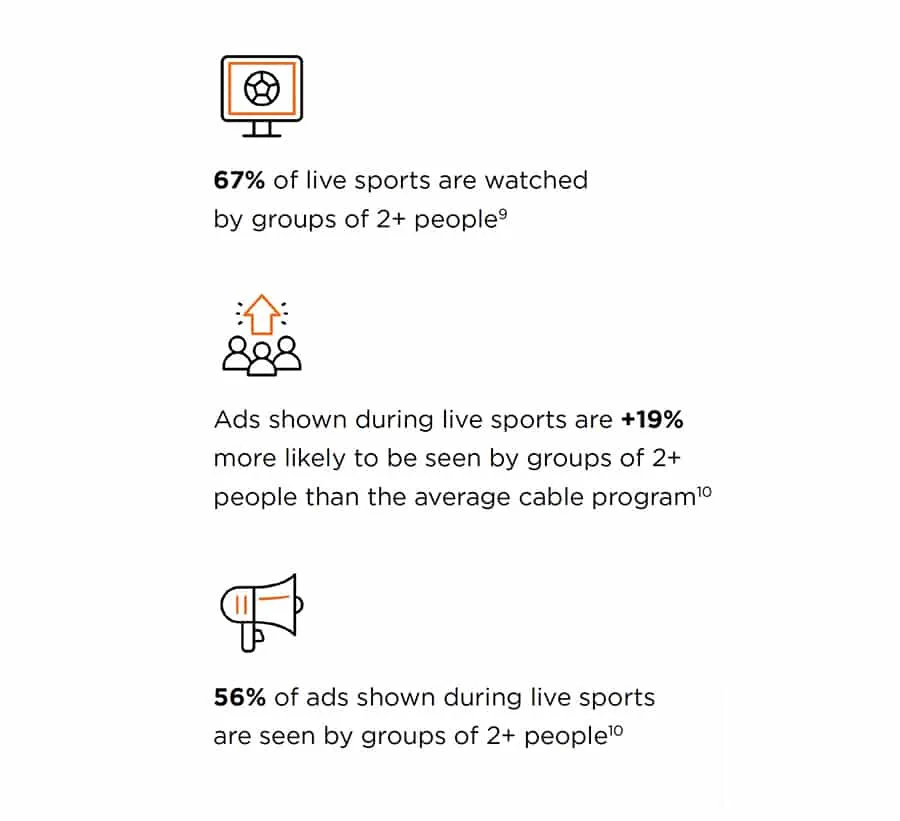
Sports offers a communal experience, bringing people together. Over two-thirds of live sports is seen by groups of 2+ people.6 Nearly 75% of fans watch regular season games in groups of three or more, and those numbers climb even higher during playoff and championship games.1 The popular co-viewing environment of sports boosts both ad visibility and audience reach, making sports a knockout strategy for advertisers.


83% of households watch live sports throughout the year,8 spending the vast majority of their time with professional sports leagues. But sports fans tune in for more than just the Big Four (NFL, NBA, MLB, and NHL). Over a quarter of all sports impressions come from other sports.9 That’s a massive opportunity for advertisers. By shifting investment to these emerging sports, brands can reach the same passionate audiences – often at a significantly lower cost.


Women’s sports aren’t just gaining ground – they’re surging. In 2024, women’s sports viewership hit new highs, with more Americans tuning in and showing interest than ever before. A recent study found that over a third of those who don’t currently follow women’s sports are open to watching in 2025.1 Among Comcast households, time spent watching women’s sports jumped 42% year-over-year.8 The WNBA in particular had a stand-out season that shattered records and raised the bar for ad conversions.
+29% increased interest in the WNBA from 2023 to 202411
+134% increase in time spent with WNBA YOY8
Viewers are +45% more likely to pay attention for the full duration of WNBA games than NBA games10
WNBA fans are 1.8X more likely to visit brands websites than other sports fans11

Whether fans tune in from the comfort of their home or from a social setting like a bar, sports bring people together.
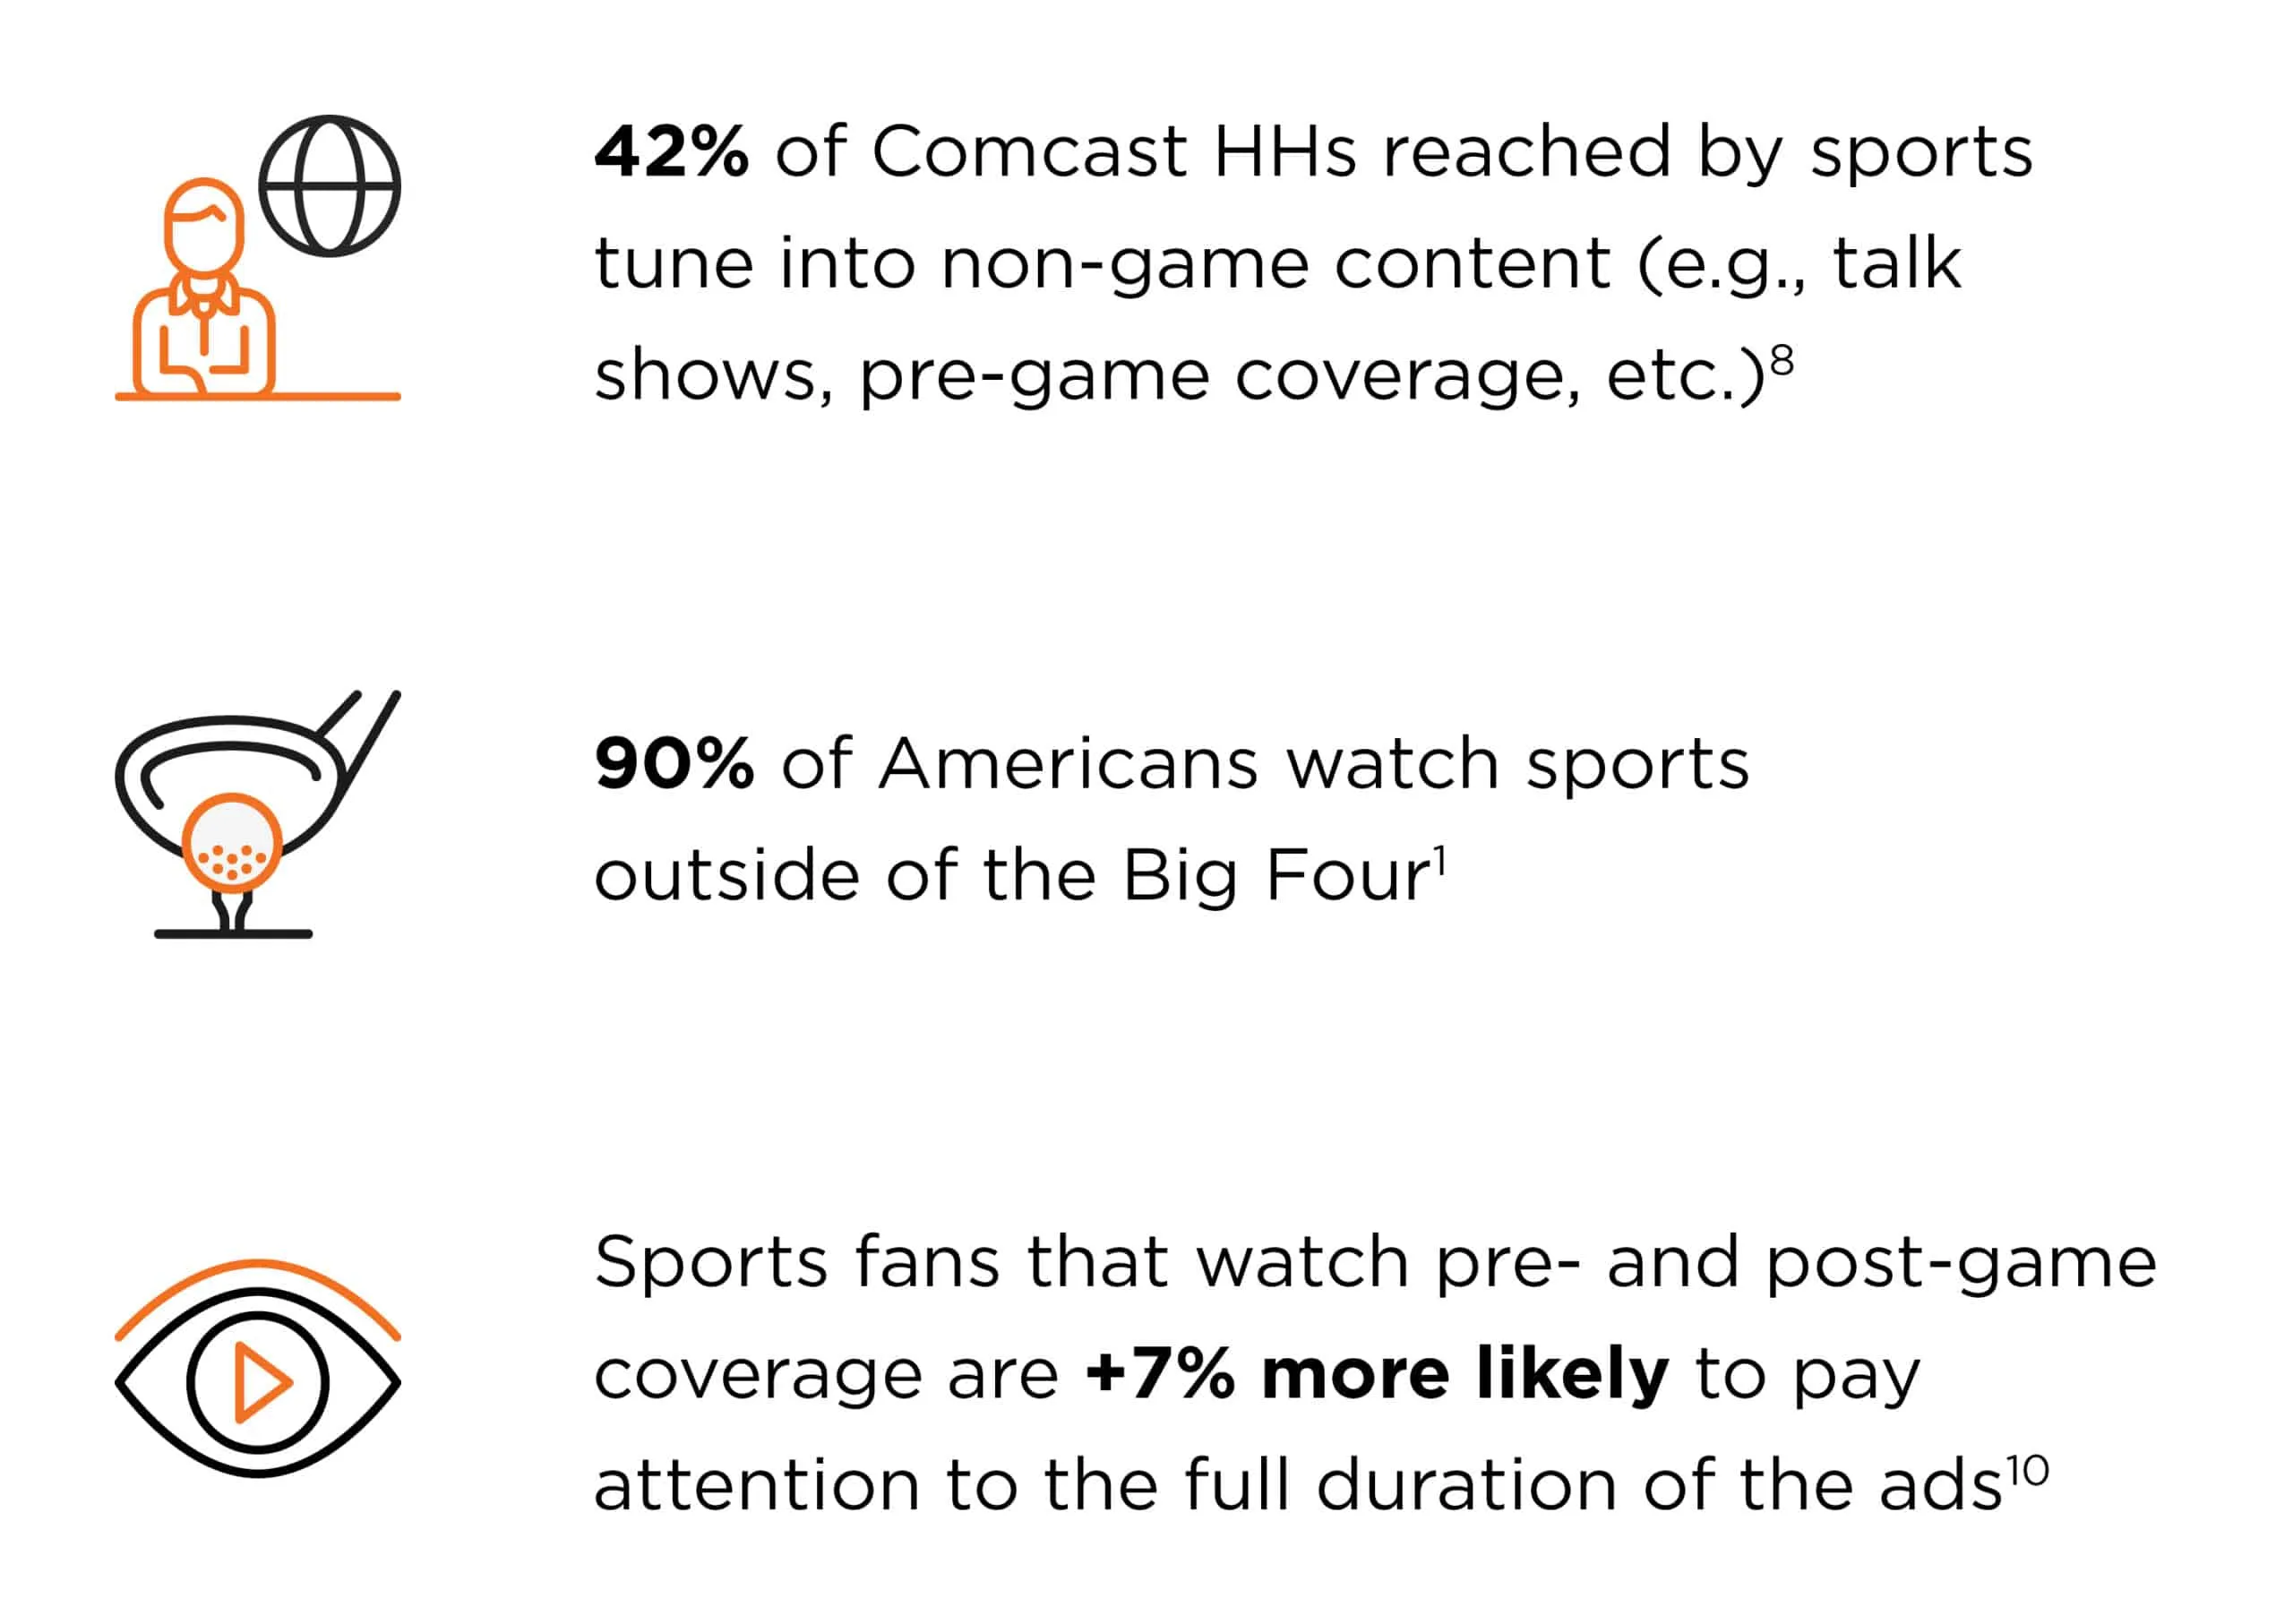
The communal experience of live sports events increases ad visibility and audience reach. And it’s not just the games that draw viewers in 20% of HHs reached by sports tune in to non-game content like pre-game footage and talk shows.5

We’ll put you in front of the right audience at the right time to drive real results.
Let’s connect, whether you have questions or
are ready to create the right campaign for your business