
The latest edition of The TV Viewership Report (TVR) explores viewership trends for the second-half of 2020 (2H ’20) as well as trends compared to the same period in the previous year.
The impacts of our “new normal” have shaped viewership patterns and behaviors overall especially with the numerous “TV moments” last year: a developing global pandemic, historic U.S. election, sports starts, stops and re-starts, to name a few. In the second half of the year specifically, the recorded shift toward live TV is significant with live TV accounting for 89% of daily viewership in 2H ’20 in Comcast households (HHs).
There was a clear need for audiences to stay up to date with news and information during the aforementioned events as well as to relax and “escape” with entertainment programing.
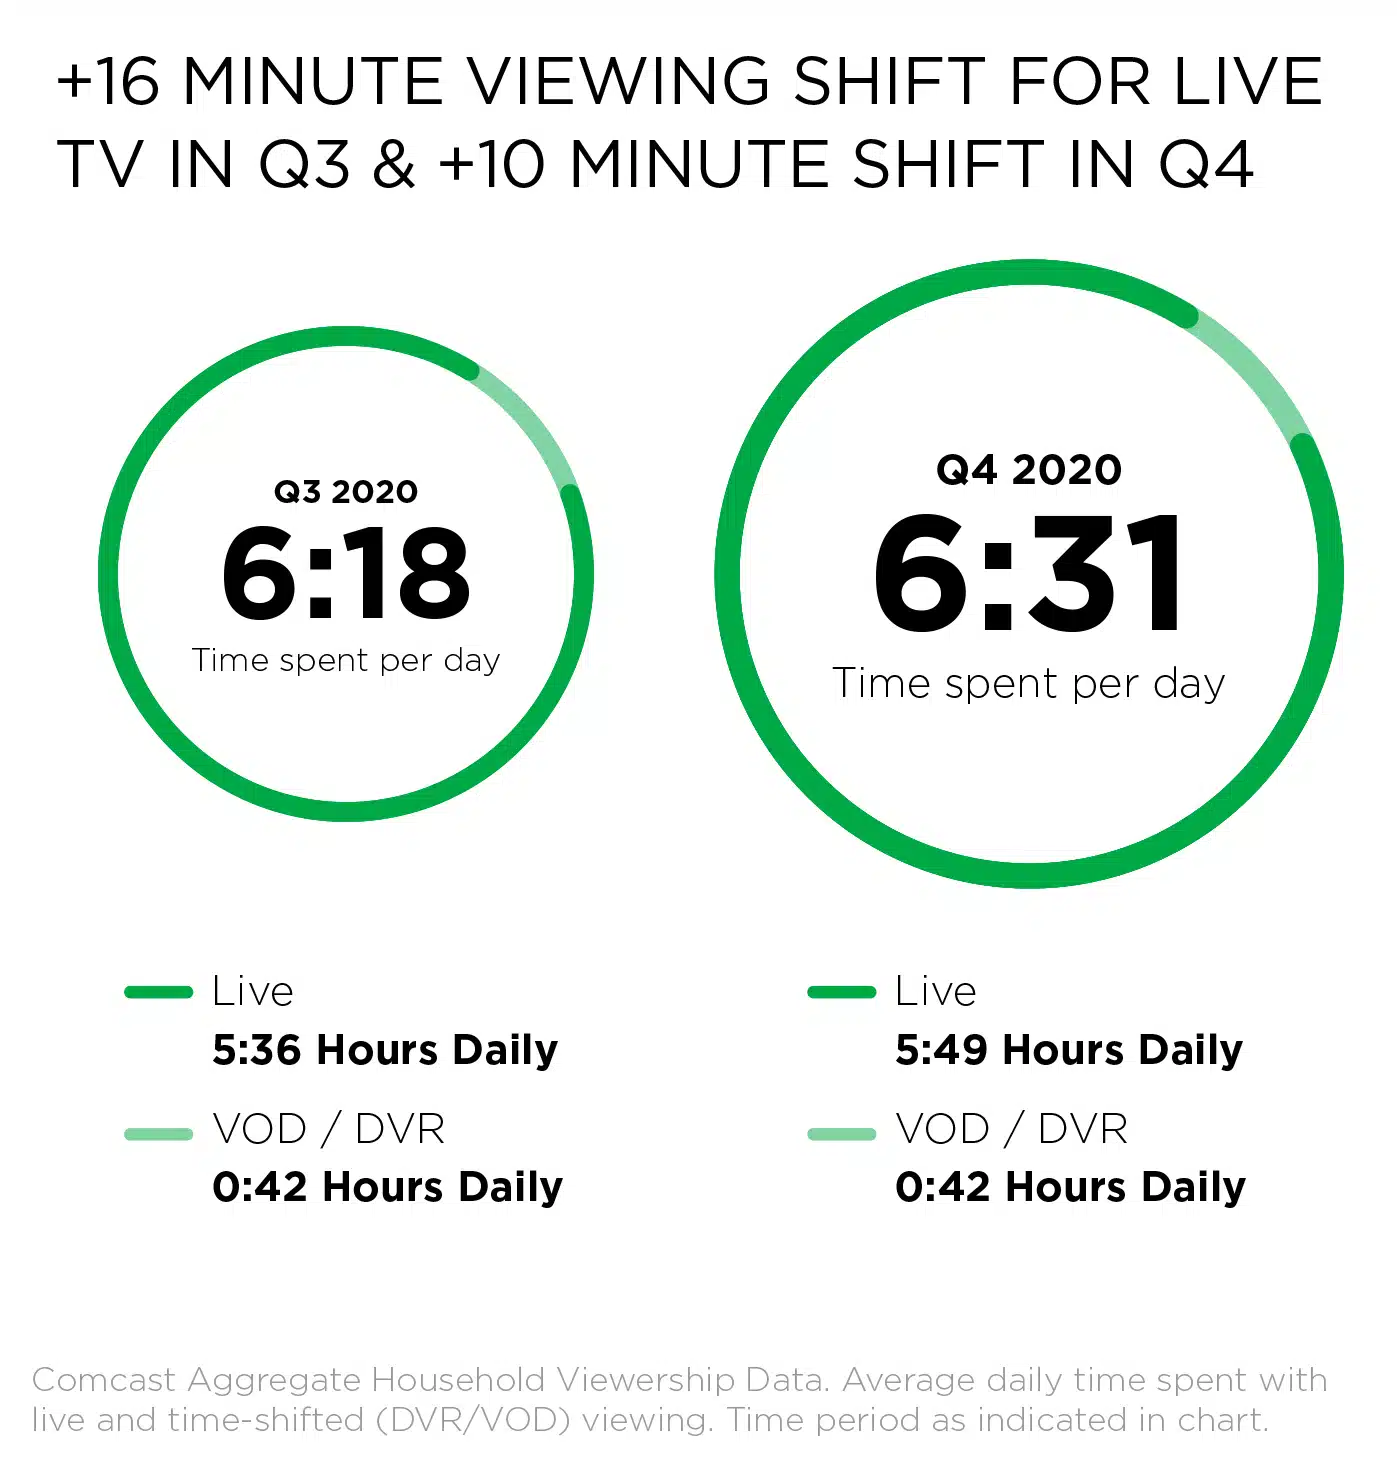
The TVR recorded an increase of +16 minutes in viewing time per day in Q3 ‘20 versus 2019 and an increase of 10+ minutes in Q4 ‘20 versus 2019. In Q3 ‘20 there was an average of 6 hours and 18 minutes of time spent with TV per day and in Q4 ’20 there was an average of 6 hours and 31 minutes.
Get these insights and more in the latest edition of the TVR which also includes The Rise of Live, an analysis dissecting 2H 2020 viewing by genre, HH income level and network/programming type.
Download The TV Viewership Report 2H 2020